I Simulated the NeurIPS Review Pipeline. Here's What Happens to Your Paper.
I reverse-engineered the NeurIPS 2026 review pipeline from their official handbook and simulated it. Here's what happens to your paper over 100 days.
What Happens to 1,000 Papers? Simulating the NeurIPS Review Pipeline
Have you ever submitted a paper and wondered what the pipeline actually looks like from above? Not the experience of waiting for reviews, but the system itself: how 1,000 papers flow through compliance checks, reviewer assignments, rebuttals, and committee decisions over the span of about 100 days?
We got curious. So we tried to model it.
The starting point
The NeurIPS 2026 Main Track Handbook lays out a surprisingly detailed workflow. Authors submit, papers go through compliance screening, then onto OpenReview for bidding, reviewer assignments, author rebuttals, area chair deliberation, senior area chair calibration, and final decisions. It's a multi-stage pipeline with distinct bottlenecks and handoffs.
The question was: can you represent that as a flow simulation and learn anything from it?
10 components, 9 connections
We broke the pipeline into 10 stages:
Authors (1,000 submissions enter the system)
Compliance Check (desk rejection screening for formatting, anonymization, dual submission violations)
OpenReview (papers go live for the committee)
Bidding & Assignment (matching reviewers to papers based on expertise and bids)
Reviewers (the actual reviewing period)
Author Rebuttal & Discussion (three-phase response: authors respond, rolling discussion, then reviewer/AC-only discussion)
Area Chairs (initial meta-reviews, discussion moderation, decision recommendations)
Senior Area Chairs (calibration across ACs, borderline paper attention)
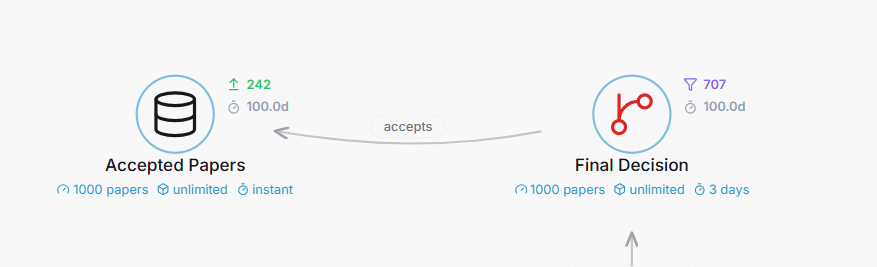
Final Decision (accept/reject, the big filter)
Accepted Papers (what comes out the other end)
Each stage has a duration, a throughput capacity, and some have filter rates.
What the simulation showed
Running 1,000 seed packets through, 242 made it to Accepted Papers. That's a 24.2% acceptance rate, which sits right in the neighborhood of real NeurIPS numbers (they've hovered around 25-26% in recent years).
The full pipeline ran 100 simulated days across 501 ticks. Two stages do the filtering:
Compliance Check filtered 26 papers (formatting violations, anonymization issues, dual submissions)Final Decision filtered 707 papers (the main selection gate)
That leaves 758 total filtered, 242 accepted.
The bottleneck turned out to be Compliance Check, with a peak queue depth of 24. It makes sense if you think about it: every single paper needs individual screening before anything else can happen. It's the narrowest throughput point even though it only filters a small percentage. Once papers clear compliance, the pipeline opens up and stages like Bidding & Assignment can handle much higher volumes.
The rebuttal as a transform, not a filter
One modeling choice that felt right: the Author Rebuttal & Discussion stage is a transform, not a filter. Papers don't get eliminated during rebuttal. They get transformed. Reviews get updated, opinions shift, misunderstandings get cleared up.
The handbook actually describes a three-phase discussion period: first authors view reviews and create an initial response (reviewers can't see it yet), then a rolling discussion opens between authors, reviewers, and ACs, then finally a reviewer/AC-only discussion phase where authors can no longer see the thread. It's more nuanced than "authors write a rebuttal." Our simulation collapses all three phases into one transform stage, but the spirit is there: 949 papers entered rebuttal, 949 papers left rebuttal. Nothing filtered, everything changed.
What's not captured
A few things the model can't represent:
The AC stage is more fluid than a single sequential block. ACs write initial meta-reviews before author responses begin, then revise them after discussion. In our model, ACs sit after rebuttal as a single stage. The real process is more of an ongoing involvement throughout.
We also don't capture the responsible reviewing policy: reviewer-authors who don't submit reviews on time lose access to their own paper's reviews. Or the desk rejection sanction for grossly negligent AC-authors. These are feedback loops and incentive structures that shape behavior in real ways but don't fit neatly into a flow diagram.
The 2026 LLM experiment is another layer we can't model. NeurIPS is running a controlled experiment where reviewers get sanctioned LLM access for some papers but not others. That creates a split in the reviewing pathway that our model treats as uniform.
The 75% question
The biggest modeling assumption is that 75% rejection rate at final decision. NeurIPS doesn't publish exact stage-by-stage attrition numbers. We backed into it from the overall acceptance rate (25%) minus the small compliance filter (5% of submissions).
In the simulation, Final Decision received 949 papers from SACs, passed 242, and filtered 707. Whether the real filtering is that sharp at the end, or whether it's more distributed (some papers effectively "decided" during reviewing, others truly borderline until the AC/SAC calibration meeting), we can't say from the handbook alone.
It's probably more gradient than cliff. But the simulation needed a number, and the math works out to land at 242 accepted.
Try it yourself
The interactive simulation is on Chinilla. You can adjust the number of papers, tweak filter rates, change stage durations, and watch the pipeline respond in real time. It's not a prediction engine. It's a thinking tool.
What we found most useful wasn't the final numbers but the act of mapping it out. Reading a 500-line handbook gives you policy knowledge. Modeling it as a flow gives you structural intuition. They're different things. One tells you what happens. The other helps you feel where the pressure builds.