Design any system.
Watch it run.
Turn your ideas into system diagrams.
Simulate how they behave, understand what breaks.
Free and open to use.
Design systems for
Drop. Wire. Run.
The IDE feels like a whiteboard. The runtime feels like a real system.
Three steps from blank canvas to running simulation.
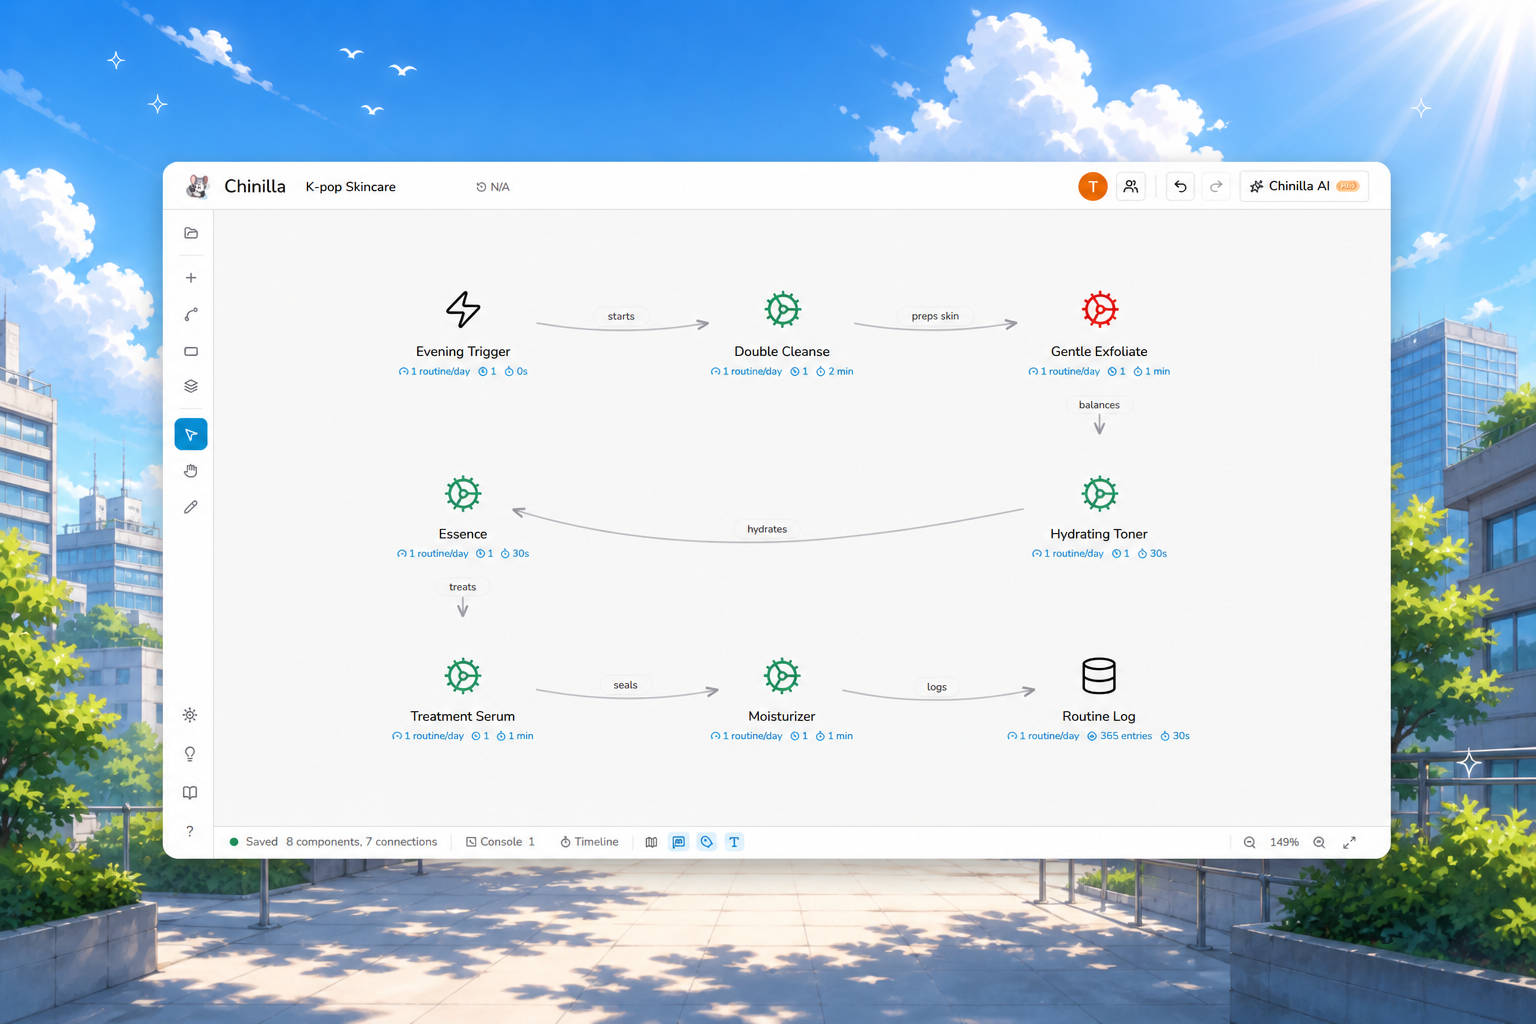
Drop blocks on canvas
7 universal building blocks. Drag, place, snap.
Person, Step, Storage, Decision, Trigger, Tool, Channel. The full vocabulary.
Wire them together
Connections carry latency, capacity, and behavior.
Attach 8 modes per node: retry, circuit breaker, batch, replicate, plus universal queueing on any component.
Run the simulator
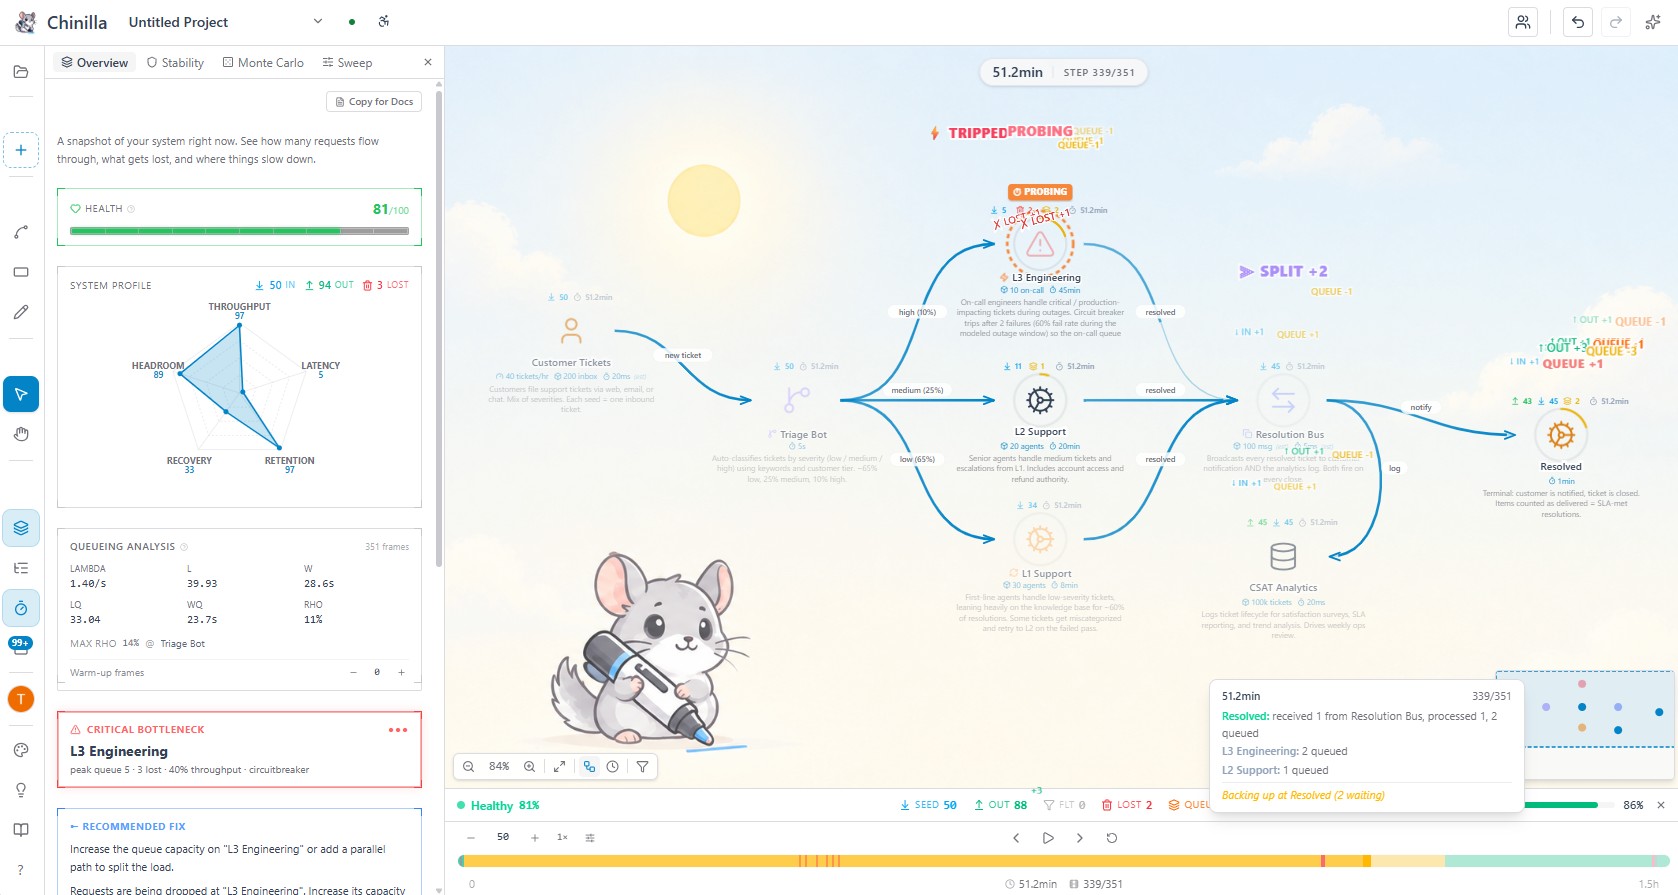
Watch real packets flow. See where it stalls.
Deterministic discrete-event engine. Same design + same seed = same result, every time.
See where it breaks.
Sketch a real system. Run packets through it.
Watch the bottleneck show up before you write a line of code.
Design together. Live.
Share a link. Same canvas, live cursors, two heads.
Flip to interview mode for a mock round with a built-in rubric.
Pro feature. 1-on-1 sessions, owner + 1 guest. Includes Interview mode with 8 hand-authored rubrics for system-design practice.
From repo to README, one canvas.
Bring your existing work in. Ship the diagram out. All in one place.
Point it at a GitHub repo.
Paste a URL. Chinilla scans the codebase and ships back a runnable diagram. 15+ languages plus YAML/JSON/TOML/XML.
Publish, embed, share.
One toggle to publish a live URL. Drop the markdown badge in your README, paste the iframe in any docs page, or just send the link. Updates as you edit.
Export anywhere.
PNG for your README. SVG for docs. Animated GIF of the simulation (Pro). Mermaid for any Markdown. System Spec as one-click markdown.
Who Chinilla is built for.
And what it is not for.
Picking the right tool starts with knowing where it fits.
Here is the honest version.
Built for
- ✓System design interview prep. Load a problem, build a design, see if it holds.
- ✓Learning architecture. Watch packets flow through queues, retries, and circuit breakers in real time.
- ✓Whiteboarding new services. Validate topology and capacity before writing code.
- ✓Teaching and content. Embed live diagrams in docs, READMEs, and lessons.
- ✓Research and academic prototyping. Deterministic seeds, Monte Carlo with 95% CIs, queueing metrics, warm-up control, baseline diffs. The fast prototype before AnyLogic or Arena.
- ✓Visual thinkers. Diagrams that respond instead of staring back at you.
Not for
- ×Production load testing. Use k6, Gatling, or Locust for hitting real services.
- ×Kubernetes or cloud deployment views. Use Lens, k9s, or Cloudcraft.
- ×Observability or APM. Use Datadog, New Relic, or Grafana.
- ×Wire-level network simulation. No jitter distributions, no GC pauses, no kernel scheduling.
- ×Capacity-planning a real fleet. The numbers you put in are the numbers you reason with.
- ×Industrial agent-based models with 10k+ agents. No custom Java behavior code, no 3D animation. Use AnyLogic or Arena for that.
Chinilla is a design + learning environment for reasoning about topology, throughput, capacity, and failure modes. Read how the engine works →
Frequently asked questions
The actual answers, not marketing copy.
Why only 7 component types? Isn't more better? ↓
Seven is the count of universal primitives (Person, Step, Storage, Decision, Trigger, Tool, Channel), not a feature ceiling. Complexity comes from composing them with 8 programmable behaviors plus universal queueing on any component with capacity set, and from topology. A hundred-icon shape library would not add expressive power, only visual noise. Same reason Lego works with a small brick set: small primitive count, infinite composition. The difference here is the boxes also run.
What are behaviors, and how are they different from components? ↓
A component is what a node IS (a Storage, a Step, a Channel). A behavior is what it DOES at runtime: queue with capacity 100, retry 3 times with exponential backoff, drop traffic above 50 RPS, trip a circuit breaker after 5 failures. The 8 behaviors are passthrough, filter, split, delay, retry, circuitbreaker, batch, replicate. Queueing is universal — any component with capacity set acts as a queue. Parameterized and attached to components. That is how you get retry storms, backpressure cascades, and rate-limit drops in the simulation. A static diagram tool has shapes; Chinilla has shapes plus runtime semantics.
What is Chinilla? ↓
A browser-based system design simulator. You build architectures from 7 universal component types, attach 8 programmable behaviors (retries, circuit breakers, rate limits, batch, and so on) plus universal queueing on any component with capacity set, and run a deterministic discrete-event simulation that shows packets flowing through your design in real time. Used for interview prep, architecture brainstorming, teaching, and stress-testing designs before writing code.
How does the simulation engine actually work? ↓
Discrete-event, not queueing-theory closed-form. The runtime identifies entry points, injects seed packets, processes one topological layer per step, applies each component's behavior (queue, filter, drop, delay, retry, and so on), and routes outputs to downstream connections. Backpressure kicks in at 80% queue capacity. Queue overflow drops the oldest packet (FIFO). Random behaviors use a fixed seed (42) so results are reproducible. Full engine docs →
What is Chinilla NOT? ↓
Not a load tester for production services (use k6, Gatling, or Locust). Not a Kubernetes or cloud deployment visualizer (use Lens, k9s, or Cloudcraft). Not an APM or observability platform (use Datadog, New Relic, or Grafana).
Does not model network jitter distributions, garbage collection pauses, cache coherence protocols, or kernel scheduling. The numbers you reason with are the numbers you put in.
It is a design and learning environment for topology, throughput, capacity, and failure modes. That is the entire scope.
How accurate is the simulation? ↓
Accurate for what it models: throughput, capacity, processing time, queue depth, drop and filter rates, retry counts, rate limits, circuit-breaker trips, and conditional branching. The deterministic seed means the same design plus the same parameters always produces the same result, so debugging and before/after comparisons are meaningful. Treat it as a high-fidelity topology and behavior simulator, not a wire-level network simulator.
How is this different from Excalidraw or diagrams.net? ↓
Excalidraw and diagrams.net are static drawing tools. The boxes do nothing. In Chinilla the components have behavior, capacity, and throughput; you connect them and packets actually flow. If you want a picture for a slide, draw it elsewhere. If you want to find out whether the design holds under load before you build it, use Chinilla. Detailed comparison →
Is Chinilla really free? ↓
Yes, completely free: cloud projects, full simulation, all 7 components, all 8 behaviors, all templates, stability scoring with Monte Carlo runs and parameter sweeps, timeline views, and PNG/SVG/Mermaid/spec export.
Does it work on mobile? ↓
Yes. Installable mobile PWA at /m/workspace with a touch-optimized canvas viewer, pinch-to-zoom, tap-for-component-details, and AI chat (Pro). Editing and simulation run best on desktop, but the mobile experience is a real first-class viewer.
Can I use Chinilla for academic papers or research? ↓
Yes, especially for the design-space exploration phase that comes before committing to a heavyweight simulator like AnyLogic or Arena.
Statistical backbone. Deterministic seeded runs, Monte Carlo with N replications and P5/P95 ranges per component, standard queueing metrics (lambda, L, W, Lq, Wq, rho via Little's Law) with a max-rho hotspot pointer, configurable warm-up periods, and side-by-side baseline diffs with color-coded percentage deltas. Sub-millisecond time resolution (ps, ns, us, ms, s, min, hr) plus frequency parsing (Hz, kHz, MHz, GHz).
Parameter sweep. Pick one or two behavior knobs (capacity, service rate, split weight), set min/max/steps, run Monte Carlo per cell. Output is a color-coded heatmap with hover tooltips for all four metrics (throughput, dropped, peak utilization, mean health).
Citation bundle. Markdown or plain LaTeX document (no extra packages required) with experimental setup, parameter table, Monte Carlo summary with mean ± 95% CI (Student's t), Little's Law table, and seed list. Pastes straight into Overleaf.
Repro bundle. Single JSON containing canvas, runtime parameters, MC seed list, warm-up frames, and queueing aggregates. Anyone can import it, hit Run, and reproduce the same numbers bit-identically.
Chinilla is not a replacement for industrial-scale agent-based modeling with thousands of agents or custom Java behavior code. It is built for the prototype-and-explore phase, browser-based, deterministic, sharable.
What about my data and privacy? ↓
Designs. Stored in Supabase Postgres on AWS. The underlying disks are AES-256 encrypted at rest. Row-level security restricts each row to its owning user.
AI features. Send your canvas state and prompt to Anthropic (Claude Sonnet 4.6) under their privacy policy. We do not log AI request content. We do not sell data.
GitHub repos. Your OAuth token is never stored in our database; it lives only in your Supabase auth session and is used at request time. We do not clone or store your source files. We store only repo metadata (owner, name, branch, last commit SHA, public/private flag) and the resulting diagram. Repo analyses are not cached or shared between users; every re-analyze runs a fresh pass.